
Welcome to Our Blogs
Top 10 Industrial Maintenance KPIs to Maximize Equipment Uptime


In manufacturing, equipment health has become much more than a maintenance concern and is considered the key to operational excellence and long-term profitability. Effective maintenance strategies boost productivity, minimize downtime, and safeguard your bottom line. To achieve this, manufacturers rely on Key Performance Indicators (KPIs) that offer deep insights into machine conditions and drive process efficiency.
In the current Industry 4.0 landscape, advanced analytics and IoT sensors have streamlined KPI tracking, providing real-time data and predictive insights, enabling you to address equipment issues before they impact production. This proactive approach enhances equipment reliability, improves worker safety, and supports data-driven decision-making.
This blog explores ten critical KPIs for equipment health, showing you how to harness these measurement tools to streamline your maintenance strategy and drive operational excellence.

10 Critical KPIs for Equipment Health
Tracking the right Key Performance Indicators (KPIs) is crucial for maintaining optimal equipment health in manufacturing. Here are 10 essential KPIs that can help transform your maintenance strategy.
Mean Time Between Failure (MTBF)
Mean time between failure (MTBF) measures the average time between equipment failures, indicating your machinery’s reliability. You can calculate it by dividing the total operational time by the number of failures over a specific period.
MTBF = Total Operational Time / Number of Failures
A higher MTBF suggests better equipment reliability and the effectiveness of your maintenance practices. Tracking MTBF helps identify patterns in your equipment failures, allowing for targeted improvements. It guides resource allocation for maintenance and informs decisions on equipment replacement or upgrades. Operators often track it on a monthly basis for consistent reliability insights and timely process improvements.
Mean Time to Repair (MTTR)
MTTR represents the average time required to repair and restore equipment to full functionality after a failure. It is calculated by dividing the total repair time by the number of repairs over a specific period.
MTTR = Total Repair Time / Number of Repairs
A lower MTTR indicates more efficient maintenance processes and quicker response times. Monitoring MTTR helps you assess the effectiveness of your maintenance team and procedures. It highlights areas for improvement in repair processes, spare parts management, and technician training. By reducing overall repair time, you can control labor expenses and protect vital production schedules.
Overall Equipment Effectiveness (OEE)
Overall equipment effectiveness is a comprehensive metric that combines availability, performance, and quality to measure overall equipment productivity.
OEE = Availability x Performance x Quality
Where:
- Availability = Actual Production Time / Planned Production Time
- Performance = (Ideal Cycle Time x Total Count) / Actual Production Time
- Quality = Good Count / Total Count
A higher OEE indicates more efficient equipment utilization and production processes. Tracking this metric provides a holistic view of your equipment’s performance. It helps identify bottlenecks in your production process and areas for improvement. By breaking down the OEE into its components, you can pinpoint specific issues affecting productivity. This will help identify whether they are related to equipment downtime, slow production rates, or quality defects.
Planned Maintenance Percentage (PMP)
PMP measures the proportion of maintenance activities that are planned versus unplanned. It is calculated by dividing planned maintenance time by total maintenance time and multiplying by 100.
PMP = (Planned Maintenance Time / Total Maintenance Time) x 100
A higher PMP indicates a more proactive maintenance strategy, which typically leads to better equipment reliability. Monitoring PMP helps you shift from reactive to proactive maintenance. It encourages better planning and scheduling of maintenance activities, reducing unexpected breakdowns and associated costs. A high PMP often correlates with improved equipment lifespan and an efficient use of maintenance resources.
Asset Utilization
This metric measures how effectively you are using your equipment compared to its potential. You can calculate it by dividing actual output by the maximum possible output over a given period.
Asset Utilization = Actual Output / Maximum Possible Output
Higher asset utilization suggests more efficient use of your equipment and resources. Tracking this KPI helps you identify underutilized equipment and opportunities for increased productivity. It can guide decisions on production scheduling, capacity planning, and equipment investments. Improving asset utilization can lead to higher output without additional capital expenditure.
Specific Energy
It measures the amount of energy your equipment uses during operation per production unit. You can calculate it by dividing the total energy used by the production output over a specific period.
Specific Energy = Total Energy Used / Production Output
Lower specific energy indicates more efficient equipment operation. Tracking this KPI helps you identify energy-intensive processes and equipment. It guides efforts to reduce energy costs and improve sustainability. By monitoring energy consumption trends, you can detect anomalies that might indicate equipment issues, allowing for timely interventions.
Maintenance Cost as Percentage of Replacement Asset Value (RAV)
This KPI measures the cost-effectiveness of your maintenance program relative to the value of your assets. It is calculated by dividing the total maintenance cost by the replacement asset value and then multiplying it by 100.
Maintenance Cost % of RAV = (Total Maintenance Cost / Replacement Asset Value) x 100
A lower percentage typically indicates more cost-effective maintenance practices. Tracking this KPI helps you assess the efficiency of your maintenance spending. It provides context for maintenance costs and helps with budget decisions. By comparing this metric across different assets or facilities, you can identify areas where maintenance practices might need improvement.
Maintenance Schedule Compliance
This KPI measures how well your team adheres to planned maintenance schedules. You can calculate it by dividing the number of completed scheduled maintenance tasks by the total number of scheduled tasks and then multiplying by 100.
Maintenance Schedule Compliance = (Completed Scheduled Maintenance Tasks / Total Scheduled Maintenance Tasks) x 100
Higher compliance indicates better adherence to preventive maintenance plans. Tracking this KPI helps ensure that preventive maintenance is carried out as planned. It can highlight issues with resource allocation or scheduling. Improved maintenance schedule compliance often leads to fewer unexpected breakdowns and extended equipment life.
Downtime to Operating Time Ratio
This KPI measures the proportion of time equipment is non-operational due to breakdowns or maintenance. You can calculate it by dividing the total downtime by the total operating time over a specific period.
Downtime to Operating Time Ratio = Total Downtime / Total Operating Time
A lower ratio indicates better equipment availability and reliability. Tracking this KPI helps you understand the impact of equipment failures and maintenance activities on production. It can guide efforts to improve equipment reliability and maintenance efficiency.
Mean Time to Failure (MTTF)
MTTF measures the average time a non-repairable component or system is expected to last before failing. You can calculate it by dividing the total operating time by the number of failed units.
MTTF = Total Operating Time / Number of Units
A higher MTTF indicates better reliability and longer-lasting components. Tracking this metric helps predict when components are likely to fail, allowing for proactive replacement. By comparing MTTF across different brands or models, you can make more informed purchasing decisions for replacement components.
How to Implement an Effective KPI Monitoring System
Follow this strategic roadmap to establish a data-driven maintenance approach for your manufacturing facility.
- Assessment: Start by evaluating your current asset conditions and KPI tracking capabilities. Conduct a thorough audit of your equipment, existing data collection methods, and reporting systems. Identify gaps in your monitoring processes and areas where you lack visibility into equipment performance.
- KPI Selection: Choose KPIs that align with your company’s goals and reflect the criticality of your equipment. Consider factors such as production targets, cost reduction objectives, and regulatory requirements. Prioritize KPIs that provide actionable insights and directly impact your bottom line.
- Technology Integration: Implement IoT sensors and data collection systems to capture real-time equipment data. Deploy analytics platforms that can process and visualize this data effectively. Ensure your technology stack can handle the volume and variety of data you will be collecting across your facility.
- Baseline Development: Using historical data and industry standards, establish performance benchmarks for each KPI. These benchmarks will serve as reference points for measuring improvement and identifying anomalies. Consider seasonal variations and production cycles when setting these benchmarks.
- Staff Training: Empower your teams to interpret KPI data and take appropriate actions. Provide training on data analysis techniques and the use of new monitoring tools. Encourage a data-driven culture where decisions are based on KPI insights rather than gut feelings.
- Continuous Improvement: Regularly refine your KPI targets, monitoring strategies, and maintenance processes based on data insights. Set up a review cycle to assess the effectiveness of your KPIs and adjust as needed. Use advanced analytics to uncover hidden patterns and optimize your maintenance approach continuously.
Final Thoughts
Monitoring the right KPIs helps you improve equipment performance, reduce downtime, and maintain a steady rhythm across your production cycle. These metrics go beyond tracking to support stronger execution and faster decisions across maintenance operations.
As manufacturers adopt Industry 4.0 principles, the shift from reactive metrics to predictive, data-driven insights becomes critical. KPIs, powered by real-time data and advanced analytics, give you the foresight to act early, optimize asset usage, and protect margins in a highly competitive market.
At Zolnoi, we believe that intelligent machine maintenance is the foundation of sustainable manufacturing. Our AI-powered platform combines sensor intelligence, machine learning algorithms, and deep industrial expertise to turn raw machine data into actionable insights. We go beyond system dashboards to help you build resilient and self-optimizing operations.
We partner with forward-looking manufacturers who want to unlock measurable value from their data. If you are ready to move toward a smarter maintenance approach, we are here to support your journey.
Book a consultation with our team today, and we will help you design a KPI monitoring strategy that delivers long-term value.
.jpg)
How To Build a Business Case For Predictive Maintenance
Ensuring equipment reliability while controlling maintenance costs is a challenge that manufacturers continue to face. As production lines become increasingly complex and efficiency demands soar, traditional maintenance practices often falls short, resulting in both unplanned downtime and unnecessarily high maintenance expenditures.
This has driven a significant shift toward predictive maintenance, an intelligent solution that harnesses data analytics, artificial intelligence, and machine learning to forecast equipment failures before they occur. By understanding both visible and hidden maintenance costs, companies can optimize asset performance, extend machinery lifespan, and achieve a strong return on investment.
This blog explores the true cost of outdated maintenance practices, highlighting how predictive maintenance reveals hidden inefficiencies while delivering measurable returns. We will also discuss key implementation strategies, critical success factors, and practical steps for building a compelling business case for proactive machine maintenance in your organization.

Unveiling the Iceberg of Maintenance Losses
Machine maintenance costs in manufacturing often extend far beyond what meets the eye, much like an iceberg. The visible expenses are only a tiny fraction of the total impact, while hidden beneath the surface are less obvious losses that quietly erode profitability.
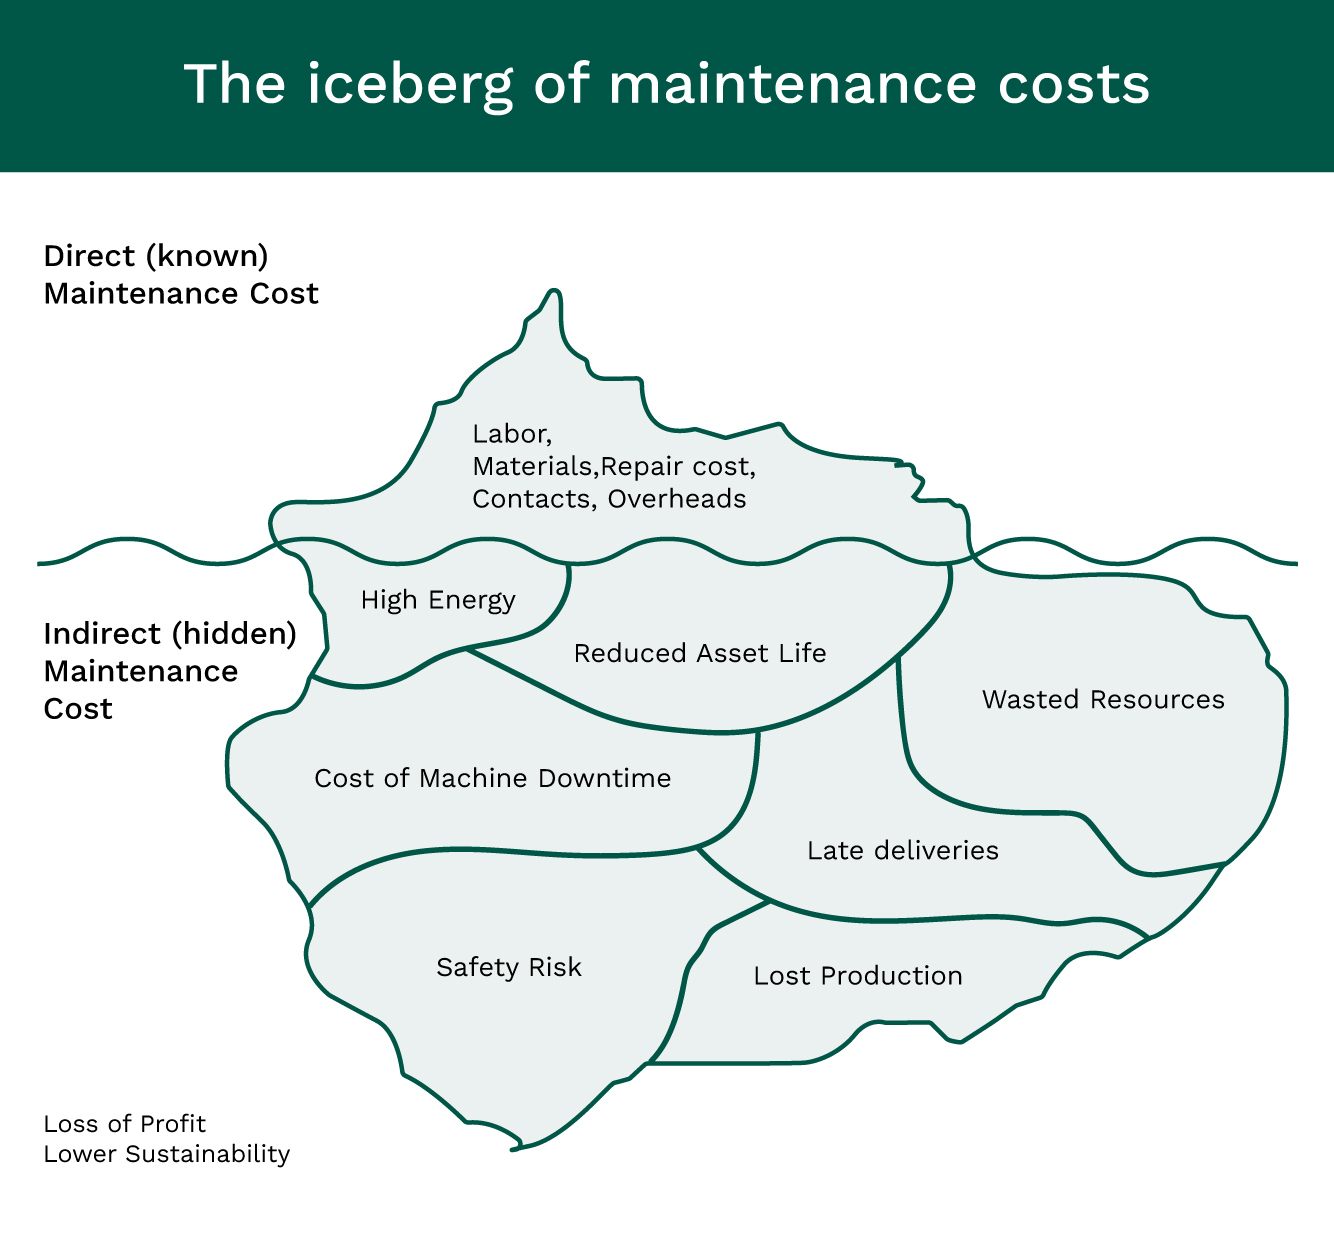
Visible Costs: The Tip of the Iceberg
The immediately apparent costs of machine maintenance include:
- Direct repair costs: When equipment fails, the immediate outlay on parts and labor is evident. Unexpected failures can result in expensive repairs and production delays that compound overall maintenance expenses.
- Replacement parts: The cost of acquiring specialized components for machinery can escalate quickly. Frequent replacements, especially when expedited shipping or specialized services are required, further strain maintenance budgets.
- Unplanned Downtime: Perhaps the most significant visible cost, unplanned downtime, can be devastating. In the petrochemical industry, for instance, manufacturers can lose up to $260,000-$2 million for every unexpected shutdowns.
Hidden Costs: The Bulk Beneath the Surface
While visible costs are substantial, the following hidden costs can often overshadow them:
- Reduced Equipment Life: Improper or inadequate maintenance accelerates wear and tear, shortening the lifespan of valuable assets. Common examples include premature compressor failure, deteriorating bearings in conveyor systems, and worn-out gearboxes.
- Safety Risks: Poorly maintained equipment increases the likelihood of accidents and health hazards. The US Department of Labor estimates that machine-related accidents cost companies $11 billion annually in workers’ compensation and lost productivity.
- Quality Issues: Equipment malfunctions often lead to defects and rework, impacting product quality and customer satisfaction. These issues can damage your reputation and lead to lost business opportunities.
- Operational Inefficiencies: Suboptimal performance of machinery results in productivity losses. 80% of manufacturing plants cite aging equipment or machine breakdowns as the leading cause of operational inefficiency.
- Compliance Penalties: Faulty equipment can lead to regulatory non-compliance. Depending on the severity and frequency of the infractions, fines for safety violations can range from thousands to millions of dollars.
Understanding Predictive Maintenance
Predictive maintenance (PdM) represents a step change from the traditional maintenance practices. Unlike preventive maintenance, which follows a fixed schedule regardless of equipment condition, PdM relies on continuous monitoring and data analytics to predict when maintenance should occur.
How PdM Differs from Traditional Maintenance Methods?
To fully appreciate the benefits of predictive maintenance, it is essential to understand the approach of different conventional maintenance strategies. They are as follows:
- Reactive Maintenance: This strategy addresses equipment issues after they occur. While this is simple to implement, it can lead to significant production losses and increased maintenance expenses.
- Preventive Maintenance: This method follows a fixed schedule regardless of equipment condition. While it helps prevent some breakdowns, it can lead to unnecessary maintenance activities and potential over-servicing.
- Condition-Based Maintenance: This approach monitors equipment and triggers maintenance when specific indicators show signs of decreasing performance. Although more efficient than preventive maintenance, it may not provide enough lead time for optimal planning and can still result in unexpected downtime.
Predictive Maintenance uses data analytics and machine learning to predict future failure points and performance issues. It optimizes maintenance scheduling, minimizes downtime, and extends equipment life, offering a more comprehensive solution to maintenance challenges.
Addressing issues proactively significantly reduces unplanned downtime. A research by Deloitte shows that Predictive Maintenance can reduce breakdowns by 70% and downtime by 50%, leading to substantial improvements in operational efficiency.
Implementing proactive maintenance strategies also contributes to energy efficiency by ensuring equipment operates at optimal levels. It reduces waste from premature part replacements and minimizes the carbon footprint associated with emergency repairs.
How Does Predictive Maintenance Reduce Maintenance Losses?
Predictive Maintenance (PdM) offers a strategic advantage by significantly reducing maintenance losses across various dimensions of industrial operations.
- Improved Machine Availability: Predictive maintenance significantly enhances machine availability by detecting potential issues early, preventing unexpected breakdowns that can disrupt production. This proactive approach ensures equipment runs reliably, supporting continuous operations without last-minute interruptions. As a result, manufacturers experience higher overall equipment effectiveness (OEE) and maintain consistent output without sacrificing efficiency.
- Targeted Cost Reduction: This strategy reduces maintenance costs by focusing on condition-based interventions. Instead of routine, fixed-interval servicing that may replace components prematurely, data-driven maintenance extends component life and reduces material waste. Industry reports suggest cost savings between 10% and 30% for organizations that adopt PdM strategies.
- Energy Savings: By optimizing equipment performance, PdM contributes to significant energy savings. Well-maintained machines operate more efficiently, consuming less energy and reducing operational costs.
- Quality Impact: Maintaining machinery within ideal operating parameters enhances product quality and reduces defects. With fewer production errors and rework incidents, organizations save on both material costs and labor, further solidifying the business case for PdM.
Beyond measurable gains, PdM offers intangible benefits that enhance overall operations.
- Proactive maintenance minimizes safety risks, creating a safer work environment.
- By ensuring equipment aligns with industry standards, PdM supports regulatory compliance, avoiding costly penalties.
- Reliable operations lead to improved customer satisfaction, as consistent service delivery builds trust and loyalty.
Predictive Maintenance in Action: Quantifying Downtime Savings for Critical Gearbox Assets
Consider a scenario involving a critical asset like a gearbox with multiple failure modes. Suppose a maintenance manager identifies ten potential issues causing downtime, with each issue resulting in an estimated loss of 10 operational hours per year, which translates to a total of 100 lost hours. If a predictive maintenance system can address eight of these issues with a 95% success rate, the potential downtime savings can be calculated as follows:
- Identified Issues Addressed: 8
- Total Potential Downtime Saved: 8 issues × 10 hours each = 80 hours
- Effective Savings at 95% Success: 80 hours × 0.95 = 76 hours saved per year
As explained in the previous section, there are other benefits across energy, quality, maintenance costs, etc., which can also be quantified. For example, one of our customers identified that during downtime, the auxiliaries are still running, and there is substantial energy waste. When quantified, that was substantial enough to cover the cost of the solution.
Maintenance managers can adapt this framework to their specific environments by analyzing historical data and using expert judgment to refine their cost-benefit analyses.
Critical Success Factors for Implementing Predictive Maintenance
Implementing Predictive Maintenance (PdM) successfully requires careful consideration of the following critical success factors:
- Machine Criticality Assessment: This process involves identifying and prioritizing assets based on their impact on operations. It serves as the foundational step in developing effective maintenance strategies, ensuring that resources are allocated to the most critical equipment. Here is how you can do the assessment:
- Step #1: Catalog all machinery and equipment within the organization.
- Step#2: Analyze potential failure modes and their consequences.
- Step#3: Assess the impact of each asset’s failure on safety, production, costs, and compliance.
- Step#4: Rank assets to focus maintenance efforts where they are most needed.
- Data Quality and Integration: The success of a PdM system hinges on the quality and reliability of the data it uses. Integrate sensors, historical logs, and maintenance records to create a robust data framework. High-quality, integrated data enables accurate forecasting and informed decision-making, ensuring that predictive maintenance delivers on its promise.
- Technology Selection: Choosing the right predictive maintenance technology is crucial. Evaluate solutions based on:
- Applicability: The technology’s relevance to your specific asset types and operational needs.
- Scalability: The ability to expand across a diverse range of equipment.
- Integration: How smoothly the solution integrates with your existing IT infrastructure. Selecting a vendor that provides ongoing support and training can further enhance the success of your PdM initiative.
- Organizational Readiness: Implementing predictive maintenance requires a cultural shift. Invest in training programs to ensure that all stakeholders, from maintenance technicians to management, understand and embrace the new processes. Align traditional maintenance procedures with the predictive model and create an environment of ongoing learning and refinement.
- Implementation Roadmap and Pilot Testing: Begin with a pilot project focused on a critical asset or production line. This approach allows you to use pilot insights to refine predictive algorithms and develop a phased roadmap that minimizes risk and disruption during full-scale deployment.
Building a Business Case for Predictive Maintenance
Creating a compelling business case for Predictive Maintenance involves a strategic approach that addresses current challenges and aligns with organizational goals.
1. Identify Current Maintenance Challenges
Start by gathering data on existing maintenance issues to establish a baseline for improvement. This step is crucial for understanding your current situation.
- Calculate total hours and cost of unplanned downtime.
- Break down maintenance costs, including direct and indirect expenses.
- Assess risks associated with equipment failures, focusing on safety and compliance.
By thoroughly analyzing these aspects, you will be able to create a robust foundation for your predictive maintenance business case.
2. Align PdM with Organizational Goals
Show how predictive maintenance supports company objectives to gain management support. This alignment is key to securing approval for implementation.
- Show how reducing downtime aligns with production targets and improves OEE.
- Estimate cost savings from reduced emergency repairs and extended asset lifespan.
- Highlight potential for increased customer satisfaction and market share due to improved reliability.
Linking PdM to strategic goals strengthens your case and increases the likelihood of approval from decision-makers.
3. Conduct a Cost-Benefit Analysis
Develop a clear financial model that outlines the investment required and potential returns. This analysis will help justify the expenditure.
- Detail initial investment costs for PdM technology, including sensors, software, and training
- Project savings from reduced downtime, decreased maintenance costs, and improved energy efficiency
- Calculate ROI and payback period to demonstrate the financial viability of PdM
A comprehensive cost-benefit analysis provides concrete evidence of PdM's value to your company.
4. Define Key Performance Indicators (KPIs)
Establish measurable metrics to track the success of your PdM implementation. These indicators will help you monitor progress and demonstrate results.
- Focus on reducing unplanned downtime and increasing the mean time between failures.
- Track the decrease in maintenance costs and improvement in overall equipment effectiveness.
- Monitor energy savings and extended asset lifespan attributable to PdM.
Well-defined KPIs provide tangible evidence of PdM's success and help justify ongoing investment in the program.
5. Outline Implementation Strategy
Provide a clear roadmap for PdM adoption to show management you have a practical plan. This strategy demonstrates your readiness to execute the project.
- Start with a pilot project on critical assets, setting specific goals and timelines.
- Outline phases for full implementation, prioritizing based on criticality and potential ROI.
- Identify necessary resources, including personnel requirements and additional tools or training.
A well-thought-out implementation plan instills confidence in the feasibility of your PdM proposal.
6. Address Potential Challenges and Summarize Benefits
Anticipate common concerns and provide solutions to show you have considered all aspects. Conclude with a powerful summary of PdM advantages.
- Address data security, system integration, and cultural change concerns.
- Outline plans for staff buy-in and adoption of new processes.
- Summarize key benefits such as reduced downtime, lower costs, extended asset life,and improved safety and efficiency.
By addressing challenges and highlighting benefits, you can present a comprehensive and persuasive case for PdM implementation.
Conclusion
Predictive maintenance (PdM) effectively addresses both the visible and hidden costs associated with equipment upkeep. Proactively monitoring machinery, reduces direct expenses like repair costs and unplanned downtime while also mitigating hidden costs such as energy waste, quality issues, and operational inefficiencies.
Zolnoi stands out as an industry leader in predictive maintenance solutions, offering a unique blend of expertise and innovation. Focusing on maximizing energy savings and improving production efficiency, we employ cutting-edge AI algorithms developed over five years of research. Our solutions outperform traditional methods, providing clients with unparalleled accuracy and reliability in maintenance predictions.
If you are thinking of implementing predictive maintenance in your factory, book a quick demo with our team, and we will be happy to help.

Electrical Current Signature Analysis: How It Can Be Used To Optimize Operations
Achieving success in an industry as competitive as manufacturing relies on ensuring equipment reliability and cost-effective maintenance. As sectors strive for increased efficiency, the need for innovative solutions to anticipate and prevent equipment breakdowns remains critical. Electrical Signature Analysis (ESA) has emerged as a powerful predictive maintenance technique that helps manufacturers monitor and enhance their equipment efficiency.
ESA employs sophisticated signal processing techniques to identify and diagnose motor and equipment issues early. This non-invasive technique analyzes subtle changes in electrical patterns, offering insights into machinery health without disrupting operations. This blog explores ESA’s functionality, its advantages compared to conventional monitoring methods, and how it assists manufacturers in boosting productivity and minimizing downtime.

What is Electrical Signature Analysis (ESA)?
Electrical Signature Analysis (ESA) is a comprehensive diagnostic technique used for condition monitoring of electric motor-driven equipment. While its predecessor, Motor Current Signature Analysis (MCSA), was developed in 1985 by researchers at Oak Ridge National Laboratory to monitor motor-operated valves in nuclear power plants, ESA has evolved into a more versatile and powerful tool for predictive maintenance across various industries.
ESA analyzes both the electrical current and voltage flowing through the power leads of an electric motor. These electrical variations, or ‘signatures,’ provide valuable insights into the motor’s health and the condition of the equipment it drives. By including voltage analysis, ESA offers a more comprehensive assessment of the entire drive train, enabling deeper insights into torque fluctuations and abnormalities beyond the motor, covering connected equipment such as gearboxes, pumps, or compressors.
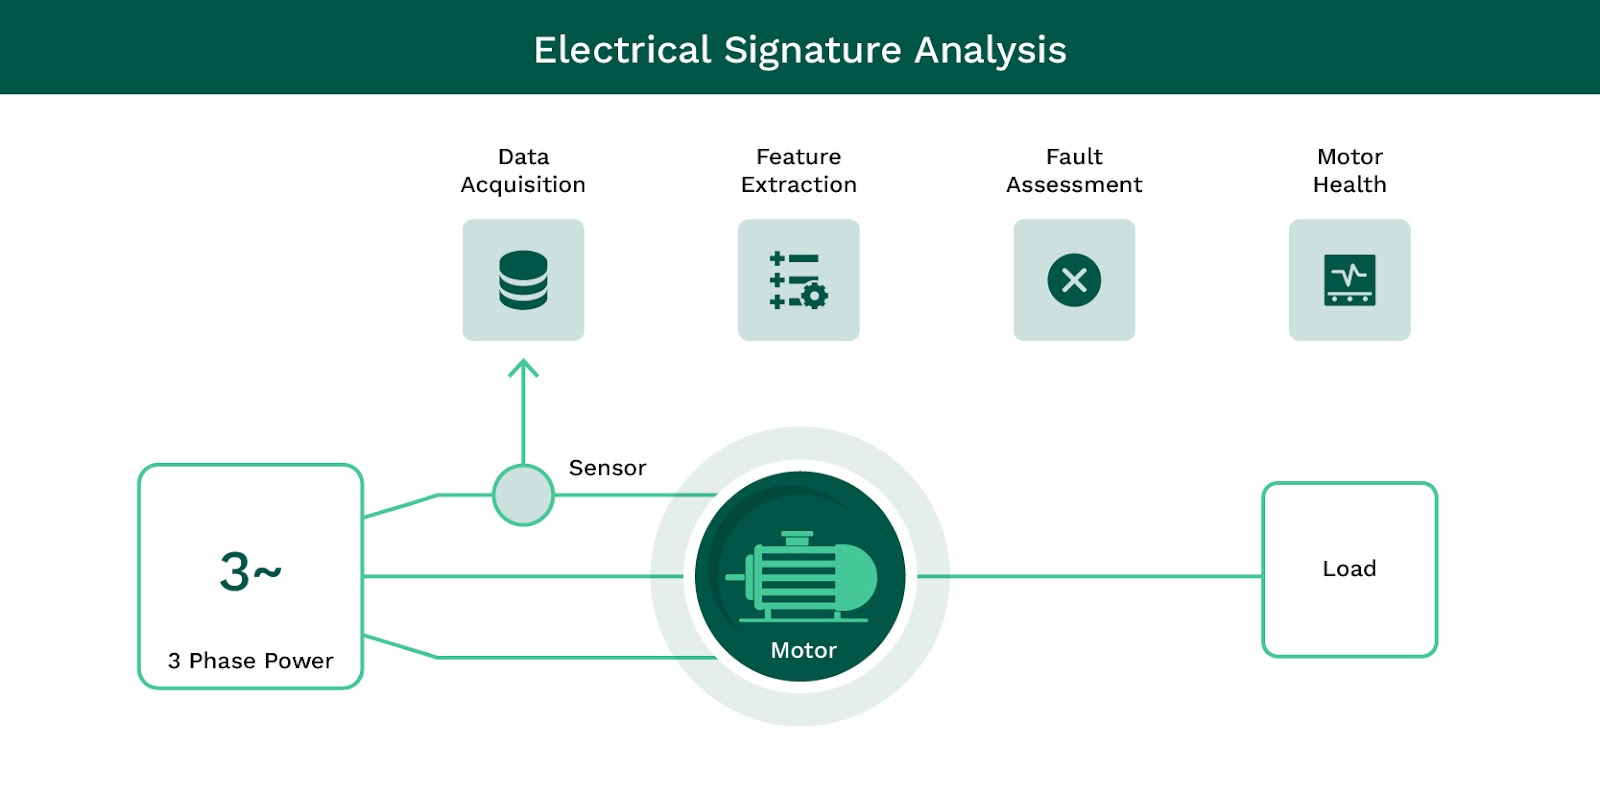
The basic principle of ESA involves three key steps:
Data Collection: Sensors installed in the motor control cabinet capture high-frequency electrical data from the machine. This allows for continuous monitoring without disrupting operations or requiring direct access to the equipment.
Signal Processing: The collected current data undergoes various signal processing techniques, the most fundamental of which is the Fast Fourier Transform (FFT). FFT converts time-domain data into the frequency domain, revealing the motor's frequency signature. This transformation is needed to identify specific frequency components corresponding to various motor faults or operational issues.
Here’s how Zolnoi does it
At Zolnoi, we use power quality meters with pre-computed individual and total harmonics to capture motor current data. Cloud-based AI models then automatically process these data patterns, mapping them to motor health indicators and fault conditions. This eliminates the need for manual FFT analysis and ensures real-time, data-driven insights for predictive maintenance. Maintenance personnel can access these results via our mobile or web application and also receive online alerts when a fault condition is detected.
Analysis and Interpretation: Advanced algorithms analyze the processed data to detect anomalies and classify faults. This step involves spectral, statistical, and time-frequency domain analysis to predict the overall health of the asset and determine fault conditions.
Anomaly detection in ESA relies on identifying deviations from the motor’s standard operating patterns. Each type of fault, such as bearing damage, rotor bar issues, or stator winding problems, produces a unique signature in the electrical spectrum. By recognizing these patterns, ESA can detect faults at an early stage, often before they manifest as noticeable vibrations or temperature changes.ESA excels in fault classification and can identify a wide range of issues:
- Air-gap eccentricity: Detects non-uniform gaps between the rotor and stator.
- Broken rotor bars: Identifies damage that can lead to sparking and overheating.
- Bearing damage: Recognizes early signs of wear in motor bearings.
- Stator winding faults: Detects shorts or other issues in the stator windings.
- Cavitation: Identifies problems in pump operations.
- Load-related issues: Detects abnormal load conditions affecting motor performance.
As technology advances, ESA continues to evolve. Modern systems incorporate artificial intelligence and machine learning algorithms to enhance fault detection accuracy and provide more detailed diagnostics.
Demystifying the myths around ESA
One common misconception about Electrical Signature Analysis (ESA) is that it is only helpful in detecting electrical issues in motors. This myth often leads to the underutilization of a powerful diagnostic tool. In reality, ESA’s capabilities extend far beyond electrical problems, making it a versatile solution for monitoring the entire drivetrain.
Consider a gearbox connected to a motor. If a gear tooth breaks, it might seem unrelated to the motor's electrical current. However, this mechanical issue creates a periodic change in the load, which the motor must compensate for. ESA detects these subtle load variations, revealing problems that traditional vibration analysis might miss.ESA's ability to detect mechanical issues extends to various components:
- Bearings: Wear or damage in bearings creates small but detectable changes in the motor's current signature.
- Shaft misalignment: Even slight misalignments affect the motor's workload, which ESA can identify.
- Pump impeller issues: Problems like cavitation or wear create distinct patterns in the motor current.
- Belt drive systems: Loose or worn belts cause load fluctuations that ESA can detect.
Embracing ESA’s full capabilities enables you to move beyond reactive maintenance. For example, If your existing Preventive Maintenance (PM) routine involves vibration and oil analysis, enabling Electrical Signature Analysis (ESA) can provide relevant data on when and where to perform such analysis. This strategic integration of ESA with your current techniques offers a comprehensive picture of your equipment’s health, leading to reduced downtime and optimized maintenance schedules.
Where does Electrical Signature Analysis (ESA) work better than traditional motor monitoring techniques?
ESA has emerged as a powerful alternative to traditional motor monitoring techniques, offering unique advantages in many scenarios. To understand where ESA excels, let’s first examine the conventional motor monitoring methods that have long been the backbone of industrial maintenance strategies:
- Vibration analysis: It involves measuring and interpreting the vibration patterns of rotating machinery. Sensors attached to the equipment detect abnormal vibrations that may indicate issues like misalignment, imbalance, or bearing faults. This method is effective but requires direct access to the machine and can be sensitive to environmental factors.
- Thermal monitoring: This method uses infrared cameras or temperature sensors to detect heat patterns in motors. Abnormal temperature increases can signal problems such as overloading, inadequate cooling, or electrical issues. However, thermal monitoring often detects problems only after they have progressed significantly, potentially missing early-stage faults.
- Oil analysis: It involves examining lubricant samples from motors or gearboxes to identify wear particles, contaminants, or chemical changes. This method provides insights into internal component health but requires regular sampling and laboratory analysis, which can be time-consuming and costly.
- Physical checkups with shut-off time: This technique requires the machine to be stalled for manual inspection. Although thorough, it leads to production downtime and may miss intermittent issues that only occur during operation.
How ESA Outperforms Traditional Motor Monitoring Methods?
While the above-mentioned traditional methods have their merits, ESA offers distinct advantages in many scenarios:
- ESA doesn't require direct access to the motor or its shutdown, allowing continuous monitoring without disrupting operations.
- By analyzing current signatures, ESA can identify developing issues earlier than methods like thermal monitoring or oil analysis.
- ESA detects both electrical and mechanical faults, providing a complete picture of motor health rather than single-focus methods.
- With sensors installed in the motor control cabinet, ESA often requires less hardware and maintenance than extensive vibration monitoring systems.
- ESA data can be easily transmitted and analyzed remotely, enabling centralized monitoring of multiple motors across different locations.
- ESA excels in monitoring motors across varying ambient conditions, reducing risks and costs associated with sensors in harsh, inaccessible, or hazardous settings.
How can manufacturers optimize operations with ESA?
ESA enables manufacturers to enhance their operations through real-time monitoring and predictive maintenance. By leveraging motor current data, companies can proactively address issues, reduce downtime, and improve overall equipment effectiveness, leading to significant cost savings and increased productivity.
Maintenance planning with real-time monitoring
Modern ESA systems offer continuous monitoring capabilities, enabling manufacturers to track motor performance trends over time. This ongoing data collection allows for establishing baseline operational parameters unique to each motor and its specific application.
By analyzing these trends, companies can generate detailed health reports for their motor fleet. These reports provide valuable insights into the condition of each motor, allowing maintenance teams to plan interventions well in advance of potential failures.
ESA systems also provide immediate alerts when anomalies are detected. For instance, if a motor's current signature suddenly changes, indicating a developing fault, the system can notify maintenance personnel instantly. This real-time alerting capability enables rapid response to potential issues, minimizing the risk of unexpected breakdowns.
Predictive maintenance implementation
Integrating ESA into a predictive maintenance strategy offers significant benefits for manufacturers. By addressing issues before they cause damage, companies can reduce unplanned downtime and extend motor lifetimes. ESA data allows maintenance teams to move beyond fixed-interval maintenance schedules, optimizing maintenance based on the actual condition of each piece of equipment.
This method guarantees that maintenance occurs solely when needed, minimizing needless interventions and related expenses. Utilizing ESA for predictive maintenance can result in significant enhancements in Overall Equipment Effectiveness (OEE). Manufacturers can boost equipment uptime, improve efficiency, and uphold superior quality benchmarks by reducing unforeseen breakdowns and streamlining maintenance timelines.
ESA enables manufacturers to transition from reactive to proactive maintenance approaches. By utilizing the insights gained from ESA, companies can make data-driven decisions that enhance operations, lower expenses, and boost overall productivity. This forward-thinking strategy extends the lifespan of essential machinery and aids in a streamlined production process.
Summing up
By providing non-invasive, real-time monitoring of motor health, ESA allows manufacturers to identify potential problems early, minimizing unexpected downtime and prolonging equipment lifespan.
This technology provides an extensive perspective on electrical and mechanical issues, outperforming conventional monitoring techniques in flexibility and effectiveness. Adopting ESA results in substantial cost reductions by streamlining maintenance schedules and enhancing energy efficiency. By tackling problems before they escalate, businesses can prevent expensive repairs and production setbacks.
About Zolnoi
Zolnoi is pioneering the use of AI-powered solutions such as ESA in the manufacturing industry. Our platform aims to improve energy efficiency, production output, and equipment upkeep through real-time data analysis and predictive insights. By combining ESA with advanced AI algorithms, Zolnoi offers manufacturers a robust solution to minimize energy use and adopt efficient predictive maintenance.
Book a free demo today and see our solutions in action.

